Page 1 of 1
Inflation - Money Velocity
Posted: Sun Feb 16, 2025 6:02 pm
by admin
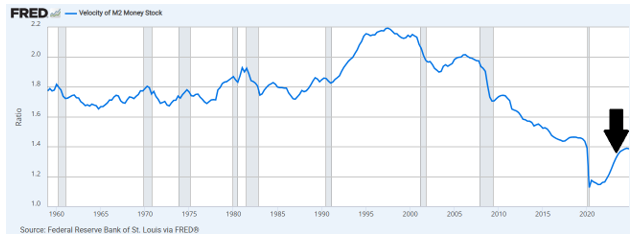
The chart above demonstrates the Money Velocity since 1960. The MV peaked just prior to the Dot-Com Bubble bursting and has been in a downward trajectory ever since. Note the black arrow to the right, t
his is where we are today. This “blip” higher in the MV is not due to an increase in economic output/activity, this the direct result of what now is,
the effect of un-needed currency/debt now just starting to chase the same amount of goods-and this is inflation.Being that the MV is near historic lows, it has taken YEARS for the effect of vast debt expansion to make its way through the economy-A HUGE LAG EFFECT. (The lower the MV, the longer the lag effect).
But now that this door has been opened, so to speak, the effect will worsen rapidly. (UNLESS DIRECT AND IMMEDIATE ACTION IS TAKEN TO STOP IT).