Following the news, investors panicked and the markets crashed. While this was five years ago, I want to bring this up today because the folks at Bespoke Investment Group recently pointed out that the S&P 500’s actions over the past three weeks have been eerily similar to the same three-week period in 2020.
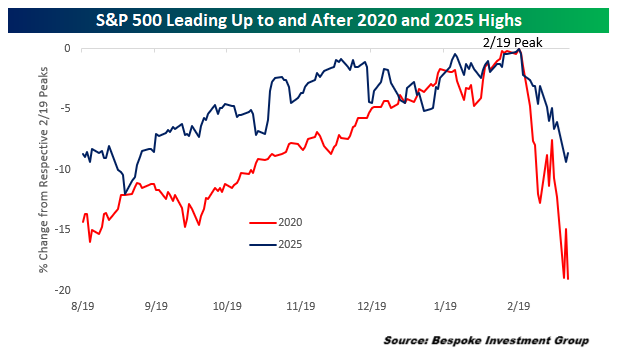
You may recall that the S&P 500 peaked and hit a new all-time high on February 19, 2020, then plunged for three weeks. In 2020, the S&P 500 lost more than 19% during those three weeks as the COVID-19 pandemic and lockdown intensified.Now, I want to remind you that the same three-week period in 2025 has been terrible – but not nearly as horrible as 2020.Consider this: The S&P 500 peaked and broke through to a new all-time high on February 19, 2025. Since then, the index dropped by about 10% by yesterday’s close, officially ending in “correction” territory. Now, a bounce back in the markets today may pull it out… for now, at least.But the tech-heavy NASDAQ has been in full-blown correction territory for a few days now.The point is, whether we’re talking about 2020 or today, one thing is clear: Uncertainty is the source of the selling.Today, we’re once again looking at a grossly oversold stock market – and I know that you’re wondering if and when a rebound will occur.Well, it could be happening now. The markets closed on an incredibly positive note today. But stocks often bounce back – by a lot – in market corrections before retesting lows.So, in today’s
Market 360, I’d like to take some time to talk about what corrections are, why the markets have been selling off lately and why you shouldn’t panic. Then, I’ll explain the catalyst that I think will turn this market around, starting next week.
What Do We Know About Market Corrections?So, what exactly is a correction? Simply put, a market correction happens when the value of a stock, bond or index falls more than 10% from its most recent high. This differs from a crash, which is a sharp double-digit drop in prices in a single day or week. A correction essentially signals that investors want out of the market.But the fact of the matter is this – a correction is not a rare occurrence; it’s actually quite common. On average, the S&P 500 experiences a correction once every year and a half, though it has been happening a lot more frequently in the past few years.The folks at Bespoke Investment Group recently noted that the NASDAQ closed more than three standard deviations below its 50-day moving average on Monday, March 10.The 50-day moving average is the index’s average price trend over the last 50 days. A “standard deviation” measures how much prices normally move up or down from that average.Closing more than three standard deviations below means the drop was way bigger than usual – a rare event that suggests extreme selling pressure.But here’s the thing to keep in mind, Bespoke also pointed out that any time the NASDAQ reaches a deeply oversold level, it is due for a bounce. In fact, Bespoke reports that in the previous instances where the NASDAQ closed three or more standard deviations below its 50-day moving average, the index produced gains 90% of the time in the following year.
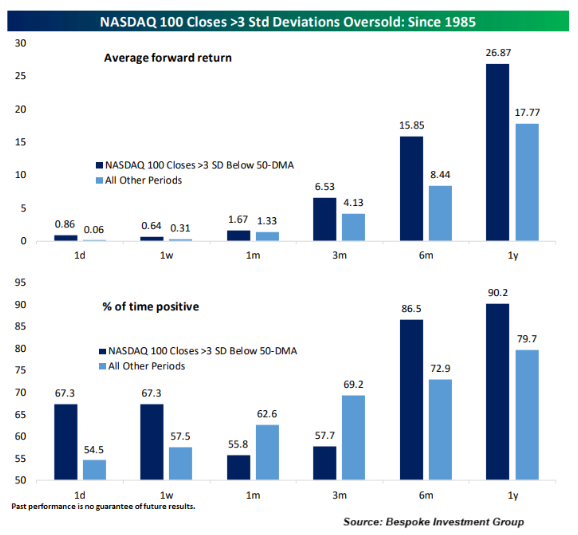
In other words, the recent correction actually bodes well for future strength. So, I’m not very concerned, and you shouldn’t be, either.Now, before we dive into how you should navigate a correction, let’s first take a look at what started the NASDAQ’s correction this year.